Viewing Development and Engineering Documentation
1. Introduction
1.1. Purpose
The user operation manual is one of the last significant documents among all documents. Its main purpose is to help users become familiar with and understand the delivered system. By reading this document, users can gain a better understanding of the system’s functionalities and how to use them.
1.2. Scope
1. This user manual is intended for the user operation manual of the online course user behavior data analysis and display system for the education platform. It helps users understand the system’s functions and usage methods.
2. Target Audience
2. The intended readers of this user manual are data analysts and data forecasters from relevant departments.
1.3. Document Conventions
The project strictly adheres to national standards related to software project development. The “Project Development Plan” specifies the overall project development process plan for the online course user behavior data analysis and display system for the education platform. This development plan must ensure that system developers and users have a unified and unambiguous understanding of the system’s current status. The described content can serve as the basis for the project’s final summary.
1.4. References
“Computer Software Documentation Specification” GB/T 8567-2006
“Software Engineering Terminology” GB/T11457—1995
“Computer Software Quality Assurance Plan Specification” GB/T12504—1990
“Guidelines for Compilation of Computer Software Product Development Documents” GB/T8567—1988
“Guidelines for Compilation of Computer Software Requirements Documents” GB/T9385—1988
“Software Documentation Management Guide” GB/T16680—1996
“Software Support Environment” GB/T15853—1995
2. Software Overview
2.1. Functionality
-
Retrieve and view information for various regions.
-
View the statistical distribution of users worldwide.
-
View the distribution of foreign users and click to view details.
-
Calculate and generate a heat map of Chinese provinces.
-
Compile and generate annual user increment charts.
-
Mine the relationship between learning completion rates and generate impact charts in chronological order.
-
Analyze the market heat in various provinces and cities in China.
-
Predict the future number and geographical distribution of active users.
2.2. Performance
2.2.1. Data Accuracy
Accuracy of user overview data is greater than 99%.
Confidence level for the relationship between learning completion rates is greater than 95%.
Accuracy of market heat analysis is greater than 95%.
Confidence in predicting the number and geographical distribution of future active users is greater than 95%.
2.2.2. Timing Characteristics
Data processing and computation time is approximately 80 seconds.
Page visualization display time is less than 500ms.
Event response time for visual page elements is less than 100ms.
2.2.3. Flexibility
The system exhibits excellent flexibility and can be used for data viewing and prediction in different operating system environments through the respective browsers. It can perform data processing and computation operations in different systems with the appropriate compilation environment.
3. Operating Environment
3.1. Hardware
-
Minimum requirement: Intel i3-level processor with over 500MB of RAM for data processing.
-
Minimum requirement: 300MB of storage space for data storage.
3.2. Supported Software
-
Windows 7.0 and above, Linux 3.0 and above kernel.
-
Python language compilation environment, R language compilation environment.
-
Google Chrome or other mainstream browsers.
4. Operation Procedures
4.1. Operating Guidelines
The system should adhere to the following points during daily operations:
-
Avoid multiple data processing operations in a short time, as this can lead to system lag.
-
Prohibit all forms of data transfer in the system, as this increases the risk of data leakage.
4.2. Daily Operation Process
If you are here for an overview of user information, please navigate to the User Overview page and search for the data you need.
If you are here for learning completion rate mining, please navigate to the Learning Completion Rate Mining page and search for the impact data you need.
If you are here to predict the number of active users, please go to the Active User Count and Prediction page to view the active user prediction curve and results.
If you are here for market heat analysis, please go to the Heat Analysis page to search for the user heat analysis data and regional school heat you need.
If you are here to explore raw data, please navigate to the Raw Data Exploration page and search for the raw data you need.
5. User Guide
5.1 User Information Overview
5.1.1 Functionality
Users can retrieve and view user information data.
5.1.2 Business Introduction
Statistical analysis of user information data from raw data and providing retrieval interfaces.
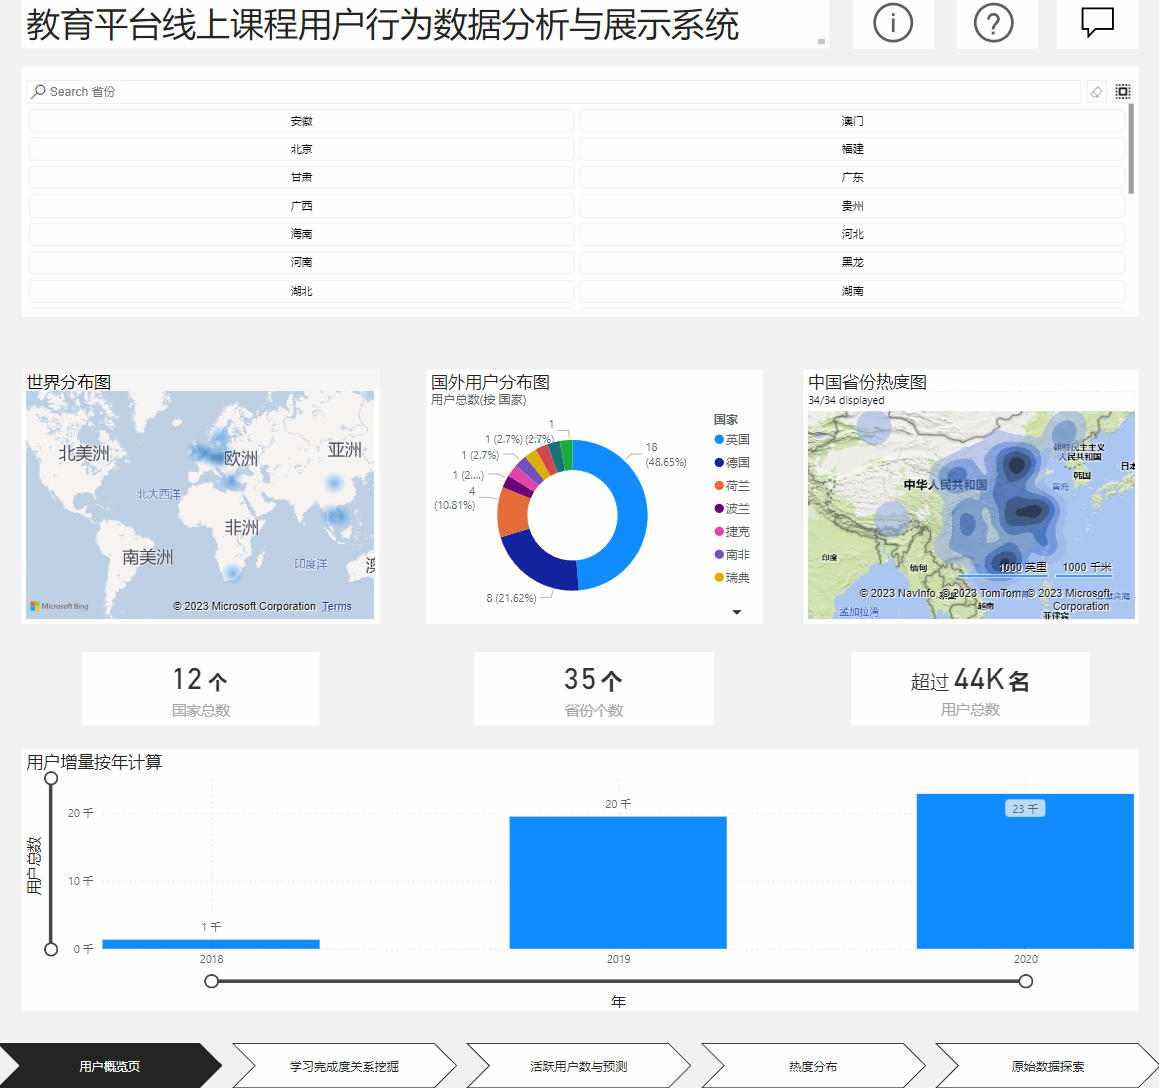
5.1.3 User Interface Illustration
5.1.4 Operating Instructions
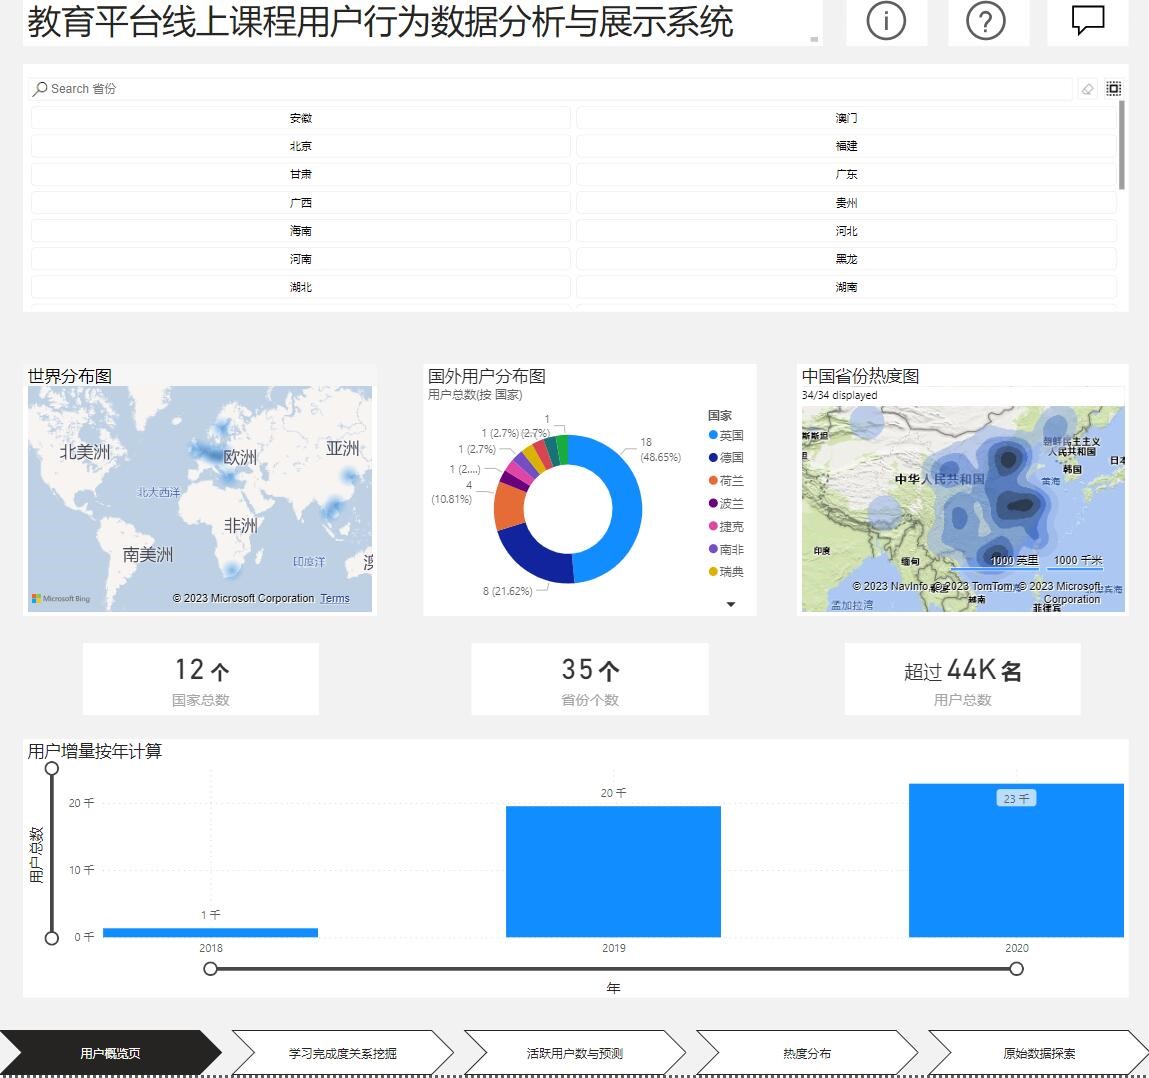
(1) Click on the User Overview page, and at the top of the page, you can perform province retrieval.
(2) Click on the world distribution map, foreign user distribution map, or Chinese province heat map in the middle of the page to view details. Click on the countries/provinces in the map to view detailed data for each country/province.
(3) Drag the horizontal and vertical coordinates in the annual user increment chart at the bottom of the page to change the range and data display format.
5.1.5 Precautions
Avoid performing province retrieval operations too quickly, as this may lead to system lag.
5.2 Learning Completion Relationship Mining
5.2.1 Functionality
Users can further explore learning completion data and find corresponding impact data.
5.2.2 Business Introduction
Statistical analysis of learning completion data from raw data and calculation of impact data.
5.2.3 User Interface Illustration
5.2.4 Operating Instructions
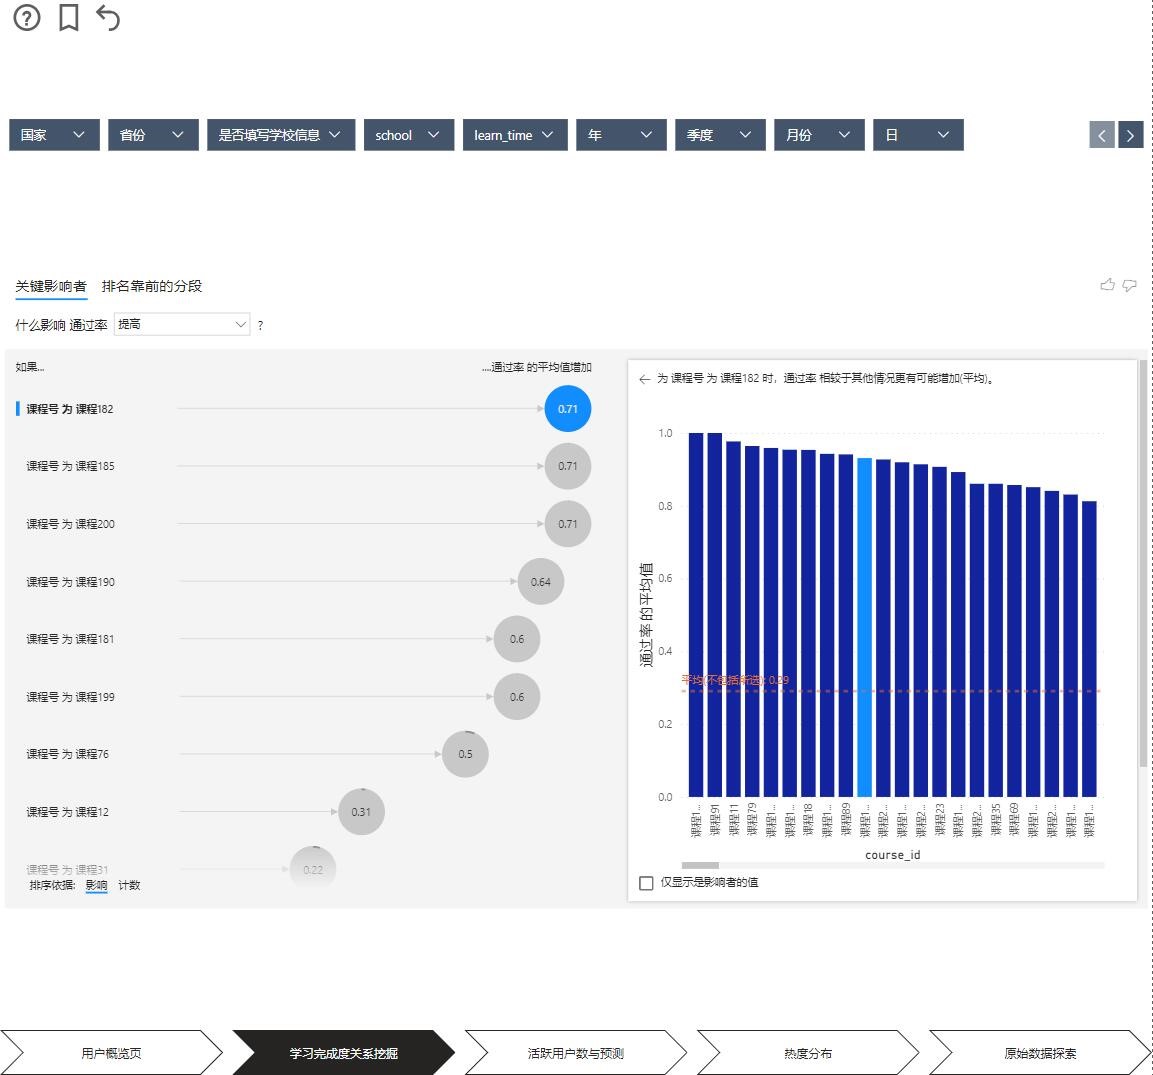
(1) Click on the Learning Completion Relationship Mining page, and at the top of the page, you can perform data filtering.
(2) Click on relationship influencers in the middle of the page to view relationship impact data. Click on the corresponding elements in the chart to view details. You can switch data sorting methods using the options box above the table.
(3) Drag the segments in the middle of the page to view data details regarding the impact of pre-exam data.
5.2.5 Precautions
Adjust the browser zoom size to an appropriate level for the best data viewing experience.
5.3 Active Users and Prediction
5.3.1 Functionality
Users can view the number of active users and predict future user numbers.
5.3.2 Business Introduction
Statistical analysis of user count data from raw data and use of models to predict future data.
5.3.3 User Interface Illustration
5.3.4 Operating Instructions
Click on the Active User Count and Prediction page to view the active user data over time and predict changes in future active users.
5.3.5 Precautions
Prediction of future user numbers requires significant computational resources. Avoid repeatedly performing predictions, as this may lead to system lag.
5.4 Market Heat Distribution
5.4.1 Functionality
Users can view market heat analysis charts.
5.4.2 Business Introduction
Analysis of the regional distribution of market heat based on raw data and visualization.
5.4.3 User Interface Illustration

5.4.4 Operating Instructions
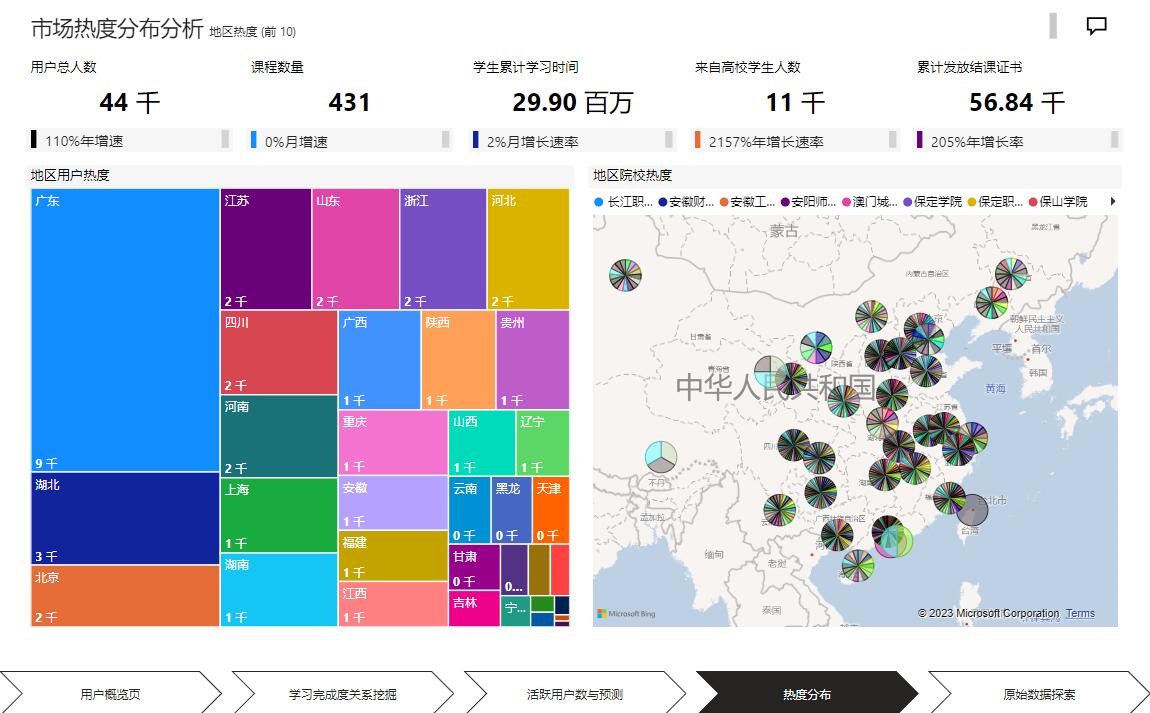
(1) Click on the Heat Analysis page to view the regional user heat map and the distribution map of regional institutions.
(2) Hover over the corresponding region/institution elements to view distribution details.
5.4.5 Precautions
Adjust the browser zoom size to an appropriate level for the best data viewing experience.
5.5 Raw Data Exploration
5.5.1 Functionality
Users can view raw data information.
5.5.2 Business Introduction
Cleaning, integration, and visualization of raw data.
5.5.3 User Interface Illustration
5.5.4 Operating Instructions
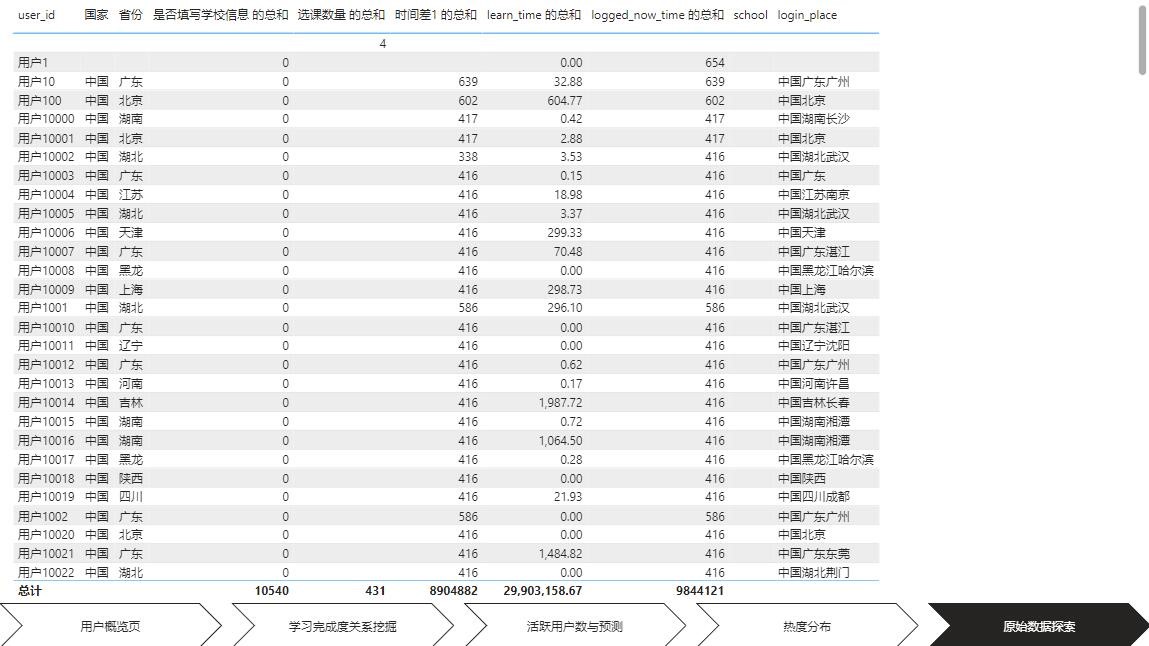
Click on the Raw Data Exploration page to view raw data information.
5.5.5 Precautions
Loading may take a long time due to the large amount of raw data.
5.6 Request for Assistance
If you have any questions about this system, please contact QQ: 1361505905.
6. Unconventional Operations
If you do not have an environment for compiling and running Python and R languages, you can perform calculations in advance on a computer with the corresponding environment and cache the results. Then, run the cached data results through a browser.